I start with a question to you before going into regression analysis explanation. Are you able to recall the moments where you have built relationship between two things? For instance, if I complete studying one chapter in two hours then I can complete one subject within a given timeline. Another example is, when you wonder if studying more hours can earn you better grades. In these situations, you need regression analysis to figure out whether there is any connection between two things or not. You can use regression analysis in order to predict stock prices, to understand if exercise affects weight loss etc.
What is Regression?
Technically speaking, regression analysis is a statistical method that is used to model the relationship variables. It predicts the value of a variable based on the value of another variable. Here, a dependent variable is a variable which is predicted. Whereas an independent variable is a variable that is used to predict another variable’s value.
Let’s take one example. You would like to know if there is any relationship between study time, sleep hours, and caffeine intake on students’ performance on a test. Here, regression analysis helps you to figure out if these factors affects the performance. The basic principle ‘to understand how changes in one variable associates with changes in another’ remains same in all types of regression analysis.
On the same Page: Linear Regression and Logistic Regression
Before going much into the details of linear and logistic regression, let’s dive into similarities and difference between them. Let’s compare apples and oranges. But take this comparison into the world of data analysis. I hope you are well aware of continuous values and categorical values. Linear regression helps you to predict continuous outcomes, while logistic regression does binary classification, and put a dependent variable in specific category based on probability.
Similarities: The similarity between linear regression and logistic regression is their method of analyzing data. The former one finds the best-fitting line, whereas the later one assists to find the best-fitting curve through the data points. Their equations use coefficients. The values of these coefficients decide the relationships between variables.
Differences: Linear regression keeps its limit for predicting continuous values. On the other hand, logistic regression predicts probability for any variable and is used to detect spam, to diagnose a disease. Thus, based on types of data, one has to use a suitable method of analysis.
Cost Function: Cost function is also known as the loss function or objective function. It is also the core part of regression analysis. Thus, cost function falls into similarities section for both regression analysis. Cost function assists in evaluating the performance of the model and optimizes model’s parameters to make accurate predictions. It calculates any difference between the predicted values and the actual values in the training data. Cost function, by minimizing itself, leads to model’s optimal parameters.
Linear Regression
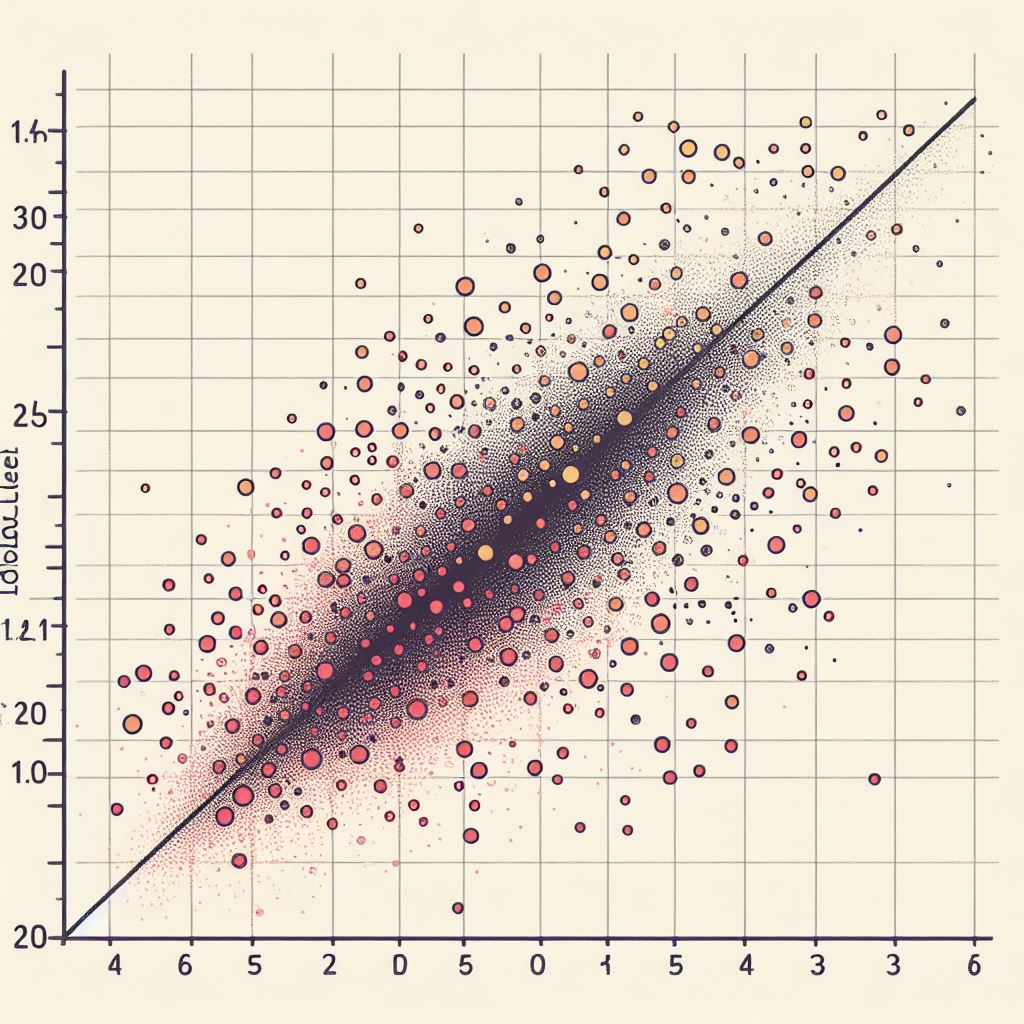
As I said already, linear regression is all about predicting continuous values. Linear regression is a statistical method that demonstrates a linear relationship between the independent variables and the dependent variable. Linear regression is the task of finding the best-fitting line through a scatterplot of data points. This line represents the relationship between two variables. A linear relationship implies that when one variable changes, the other changes in a consistent, linear manner. If there is a linear relationship between a stock price and its listing age, then as everyday stock increases.
The fundamental step in building a predictive model is identifying variables. In order to identify variables, you have to understand the objective of regression analysis. Brainstorm and identify independent variables that may affect the dependent variable. Consider both quantitative variables and qualitative variables. After careful evaluation, finalize the list of independent variables.
Linear Regression Equation: Now, we reached to the core part of linear regression analysis, and it is its equation. The equation for linear regression is defined as follows:
(1) 
Here, Y represents the dependent variable, X1, X2 ,…, Xn are independent variables, β0 is the intercept, β1, β2, …, βn are coefficients, and ϵ is the error term. Coefficients in above equation determine strength and direct of the relationship between the variables. Each coefficient represents the change in the dependent variable for a one-unit change in the corresponding independent variable.
Cost Function
The most commonly used cost function for linear regression is the mean squared error (MSE). It is defined as follows:
(2) 
Here, n is the number of training samples, Yi and Y^i is the actual and predicted values of the dependent variable for ith sample. MSE gives penalty to the model if the predicted values deviate from the actual values in the training data. The less difference between the model’s predictions and the actual values returns a lower MSE, whereas the large difference returns a higher MSE.
Logistic Regression
As we are starting a new topic, I just repeat myself about what I have already said earlier. The main difference between linear regression and logistic regression is their use prediction. The former predicts continuous outcomes, whereas the later predicts the probability of the variable belongs to the particular category. Coming to the definition, linear regression is statistical method that models the relationship between independent and dependent variables. Here, the dependent variable is a binary type categorical variable.
To understand it more clearly, I give you one real-world example. You come to the situation where you have to decide whether you should go to play tennis or not. The decision depends on various factors such as weather condition, time available, etc. These factors play a role of independent variable, while playing tennis or not is binary dependent variable. Logistic regression analysis will give you probabilities for playing tennis based on the values of independent variables. The logistic regression analysis refers to categorical prediction, which means that outcomes can fall into classes. The dependent variable can only have two possible outcomes, play or not to play, in case of binary classification.
Logistic Regression Equation: Now, we have reached to the core part of logistic regression analysis, and it is its equation. The equation for logistic regression is defined as follows:
(3) 
Here, P represents the probability of belonging to the positive class, β0 is the intercept term, β1 is the coefficient associated with the predictor variable X, and e is the base of the natural logarithm. The above function, basically, converts the relationship into probabilities, which again fall between 0 and 1. Each coefficient in above equation represents the change in the log-odds for a one-unit change in the corresponding independent variable.
Cost Function
The most commonly used cost function for logistic regression is the binary cross-entropy (BCE). It is defined as follows:
(4) 
Here, BCE represents the cost function, N is the number of training examples, yi is the actual class label for the ith example (0 or 1), p(yi) is the predicted probability that the ith example belongs to the positive class. Binary cross-entropy gives penalty to the model if the model makes incorrect classification for a variable. When the model predicts probability close to the actual class label, then BCE will be a lower value. However, misclassification increases the loss exponentially.
Conclusion
Concluding the article, linear and logistic regression give analysts the possibility of grabbing meaningful information from data. The application of both methods has the different direction. This direction is based on the type of data. Linear regression is suitable for predicting continuous values, while logistic regression is capable of predicting probabilities of a dependent variable and decides its belongness to a class. Moreover, cost function assists us to make the model optimal.